Students & Alumni
Hear from our students and alumni about their diverse backgrounds and culturally inclusive clinical practices.
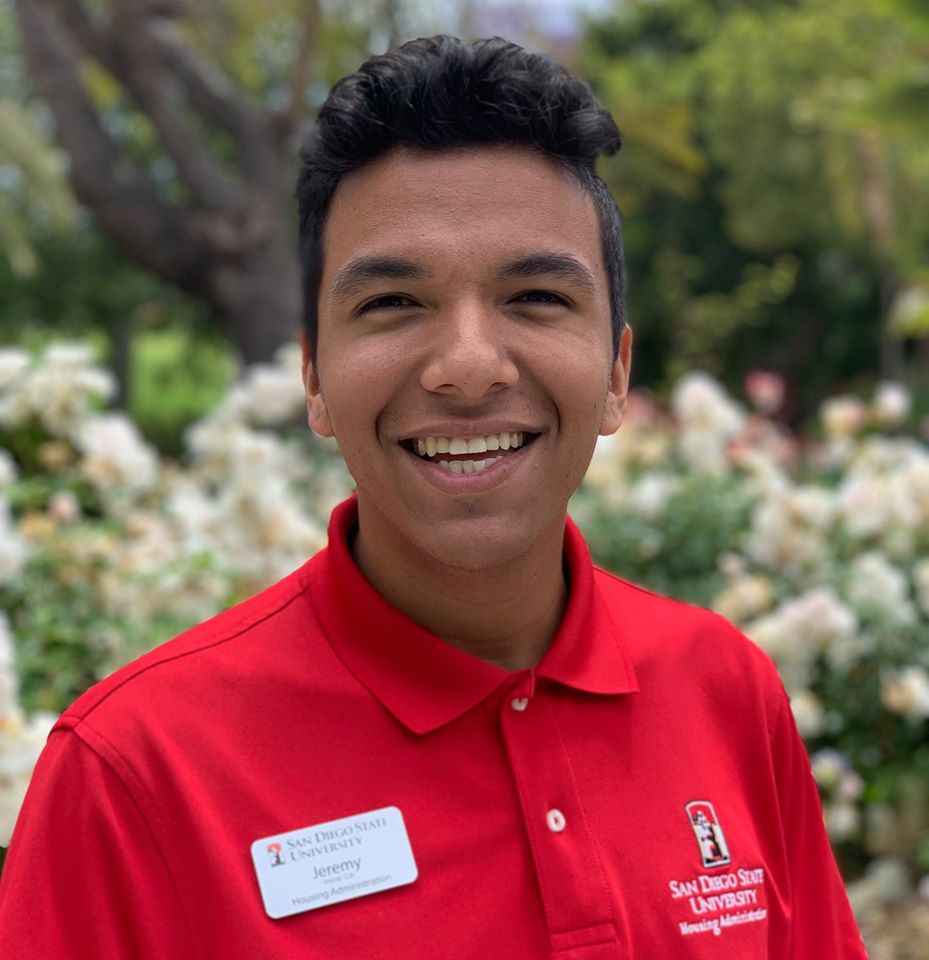
Jeremy Garcia
I would say my cultural identities influence my clinical thoughts and practices in the way that I've started to think more about how discourses influence our clients based on their multiplicity of identities. It can affect how an individual is conceptualizing themselves and their "problem". Identifying as both a gay man and Mexican American, I've been able to see how that impacts how I show up in a space and in the interactions I have with fellow individuals. I utilize this knowledge clinically by not making assumptions about the lives of clients, and by asking questions about how they make meaning from their identity and the 'cultural norms' that may be associated.
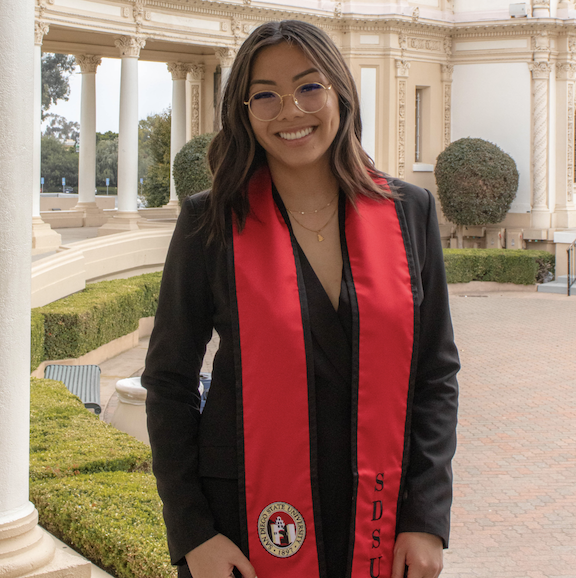
Angel-Lynna Tran
Coming from a Vietnamese-American background, culture plays such an important role in the work that I do. Due to my cultural identity and often having my voice silenced, I want to make sure that my clients do not feel that way. I strive to make sure that the clients I work with are valued and seen through the lens that they want to be seen through. With that, I work towards being mindful that not each individual is going to respond to the same practices. The term “therapy” can be understood in a variety of different ways and I make sure to meet my client where they are at.
News
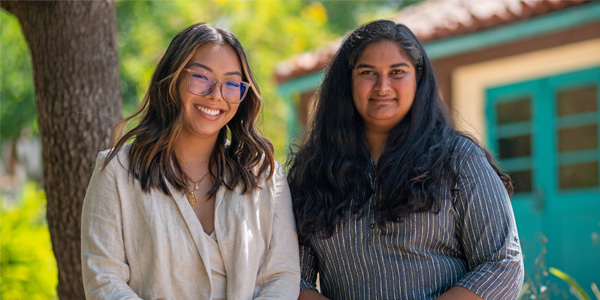
MFT Program Breaks Down Mental Health Barriers for Communities of Color
Read about how Alumni Angel-Lynna Tran and Ayuja Dixit want to change the narrative of mental health.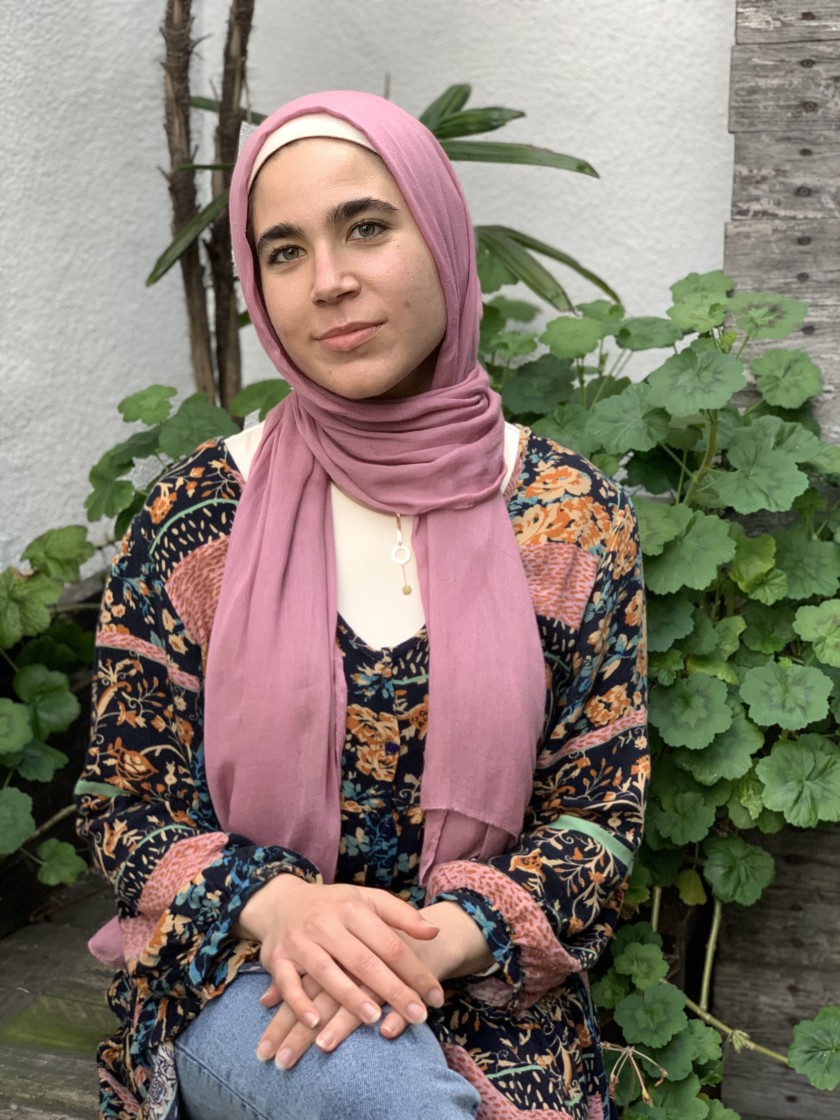
Opinion: My Lebanese family once questioned my career as a therapist. Now they ask for help.
Read about Alumni, Sarah Kouzi's, experience as a therapist.
Student Demographics
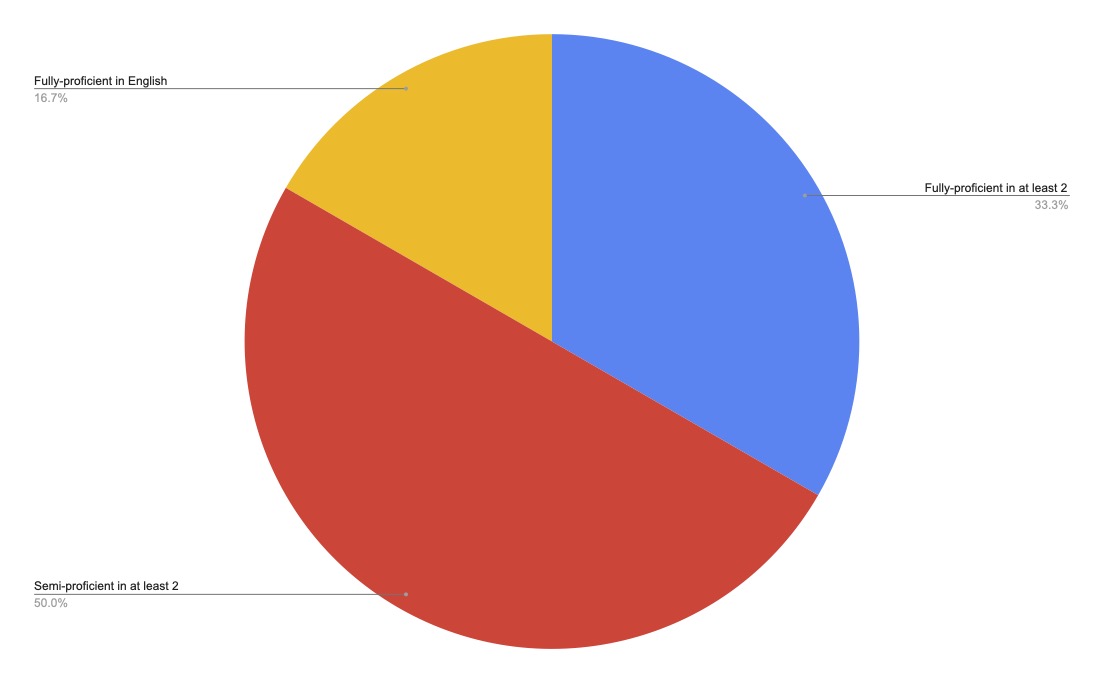
Pie chart - Language Proficiency of Our Students: 16.7% Fully-proficient in English, 33.3% Fully-proficient in at least 2 languages, 50% Semi-proficient in at least 2 languages.
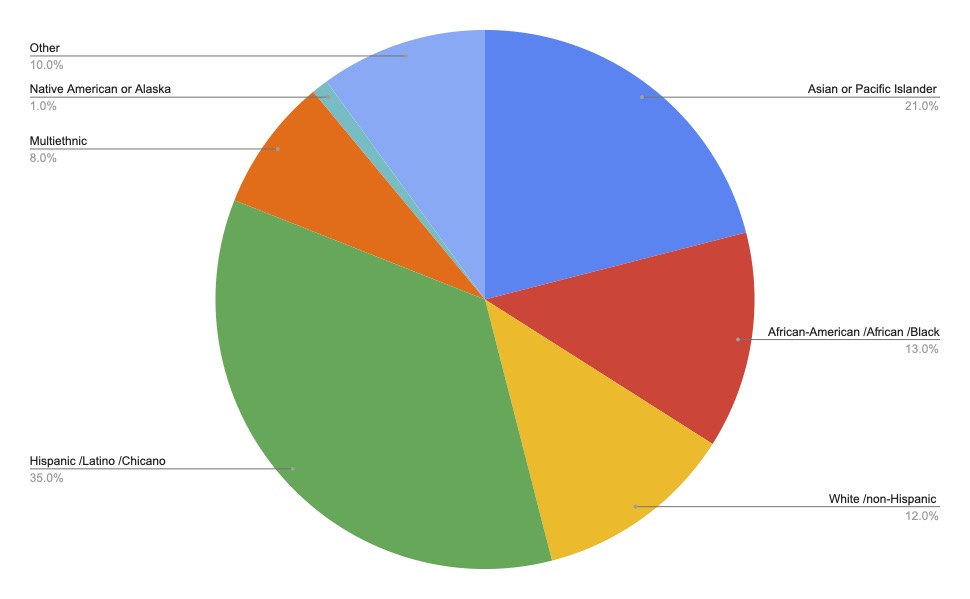
Pie chart - Race and Ethnicity of Our Students: 1% Native American or Alaska, 8% Multiethnic, 10% Other, 12% White/non-Hispanic, 13% African-American/African/Black, 21% Asian or Pacific Islander, 35% Hispanic/Latino/Chicano.